At the turn of the 21st Century, baseball researcher Voros McCracken began publishing findings revealing that pitchers have a surprisingly small amount of control over what happens to the balls they allow into play. As his findings were reviewed and corroborated by mainstream researchers, they became the basis for a revolution in pitching evaluation: Defense-Independent Pitching Statistics, or DIPS. The basic idea is this: from year to year, the batting average that a given pitcher will allow solely on balls that are hit into play, for any pitcher, is about .300. There are variations from this number, but they are small - generally not any more than 3% one way or the other, and that’s at the extreme end. On the other hand, the rate at which pitchers strike batters out, walk batters, and allow home runs can vary wildly from pitcher to pitcher, and more importantly, there is a very strong year-to-year correlation for these statistics for each pitcher (though less so for home runs). What this implies is that contrary to the long-held traditional thought, which held that the production of opposing hitters was almost completely, if not completely controlled by the pitcher, the only factors that can really be confidently attributed to the pitcher as skills under their control are strikeouts, walks, and home runs - in other words, and this is the heart of the whole thing - the three events that the defense has no part in. If each pitcher is allowing basically identical contact when the ball is struck in play, then the blame for runs that score off of hits should go to the defense, and other factors like sequencing - giving the pitcher credit only for factors directly in his control.
Of course, we know now that this is not the whole story, and the data goldmine that is Statcast has provided all sorts of ways to look harder at that batted ball data, and actually tease out the subtle ways that pitchers do exert control over batted balls. It’s maybe even more accurate to say that while statisticians never lost sight of the fact that some pitchers do indeed have a skill at inducing weak contact, there was never until now enough data to properly model it in a way that was significantly better than when only strikeouts, walks, and home runs were considered.
All that said, the jumping-off point for fbFIP was of course FIP, or Fielding Independent Pitching - for so long now the gold standard of defense-independent pitching analysis. It was developed by statisticians Tom Tango and Clay Dreslough, and though there have long been more advanced defense-independent pitching statistics, it has a great mix of performance and simplicity that has given it staying power.
One important advancement to FIP was the statistic
Another facet of pitcher contact management that predates Statcast is the realization that infield fly balls almost always wind up as outs, and the rate of infield fly balls shows a modest year-to-year correlation, making it tentatively considered a skill. This has led many to propose that it be placed in the same category as strikeouts, a pitcher-induced guaranteed out, for the purposes of DIPS statistics. I first encountered this idea on Fangraphs; I don’t know in what article, so I leave this excellent writeup on the subject here. At the time I encountered it, this idea piqued my interest; I had been toying with the idea of modifying xFIP so that instead of being regressed to the league-average HR/FB rate, it would be regressed to the individual players’ career HR/FB rates. I decided to marry these two ideas, and create what I now call “fbFIP”, or “Fly Ball-Incorporated Fielding-Independent Pitching”. The formula is as follows:
League ERA - (((13*League HR) + (3*(League BB + League HBP)) - (2*(League K + League IFFB)))/League IP)
As you may have read in the article linked earlier on this page, there is a lot that goes into whether or not a given formula can be called “predictive” or not. For instance, Cameron recommends that infield fly balls be weighted lower than strikeouts, as they have a worse year-to-year correlation. I have not taken this step. Most importantly, the weights in FIP are actually chosen based off of run values, instead of being found through the process of regression, meaning that it functions as a descriptive rather than predictive metric. Of course, that said, Cameron acknowledges that despite this FIP demonstrates predictive value better than that of at least ERA, and it has long been used for that purpose. This is significant because I have not altered the weights in making fbFIP, although of course, xFIP is used widely as a predictive metric with those very same weights still in use. All this is to say that the greatest extremes of statistical rigor have not necessarily been applied to this project, but - with that said - I have run an analysis of how the predictive power of fbFIP stacks up against some other similar metrics, and I think the results are telling.
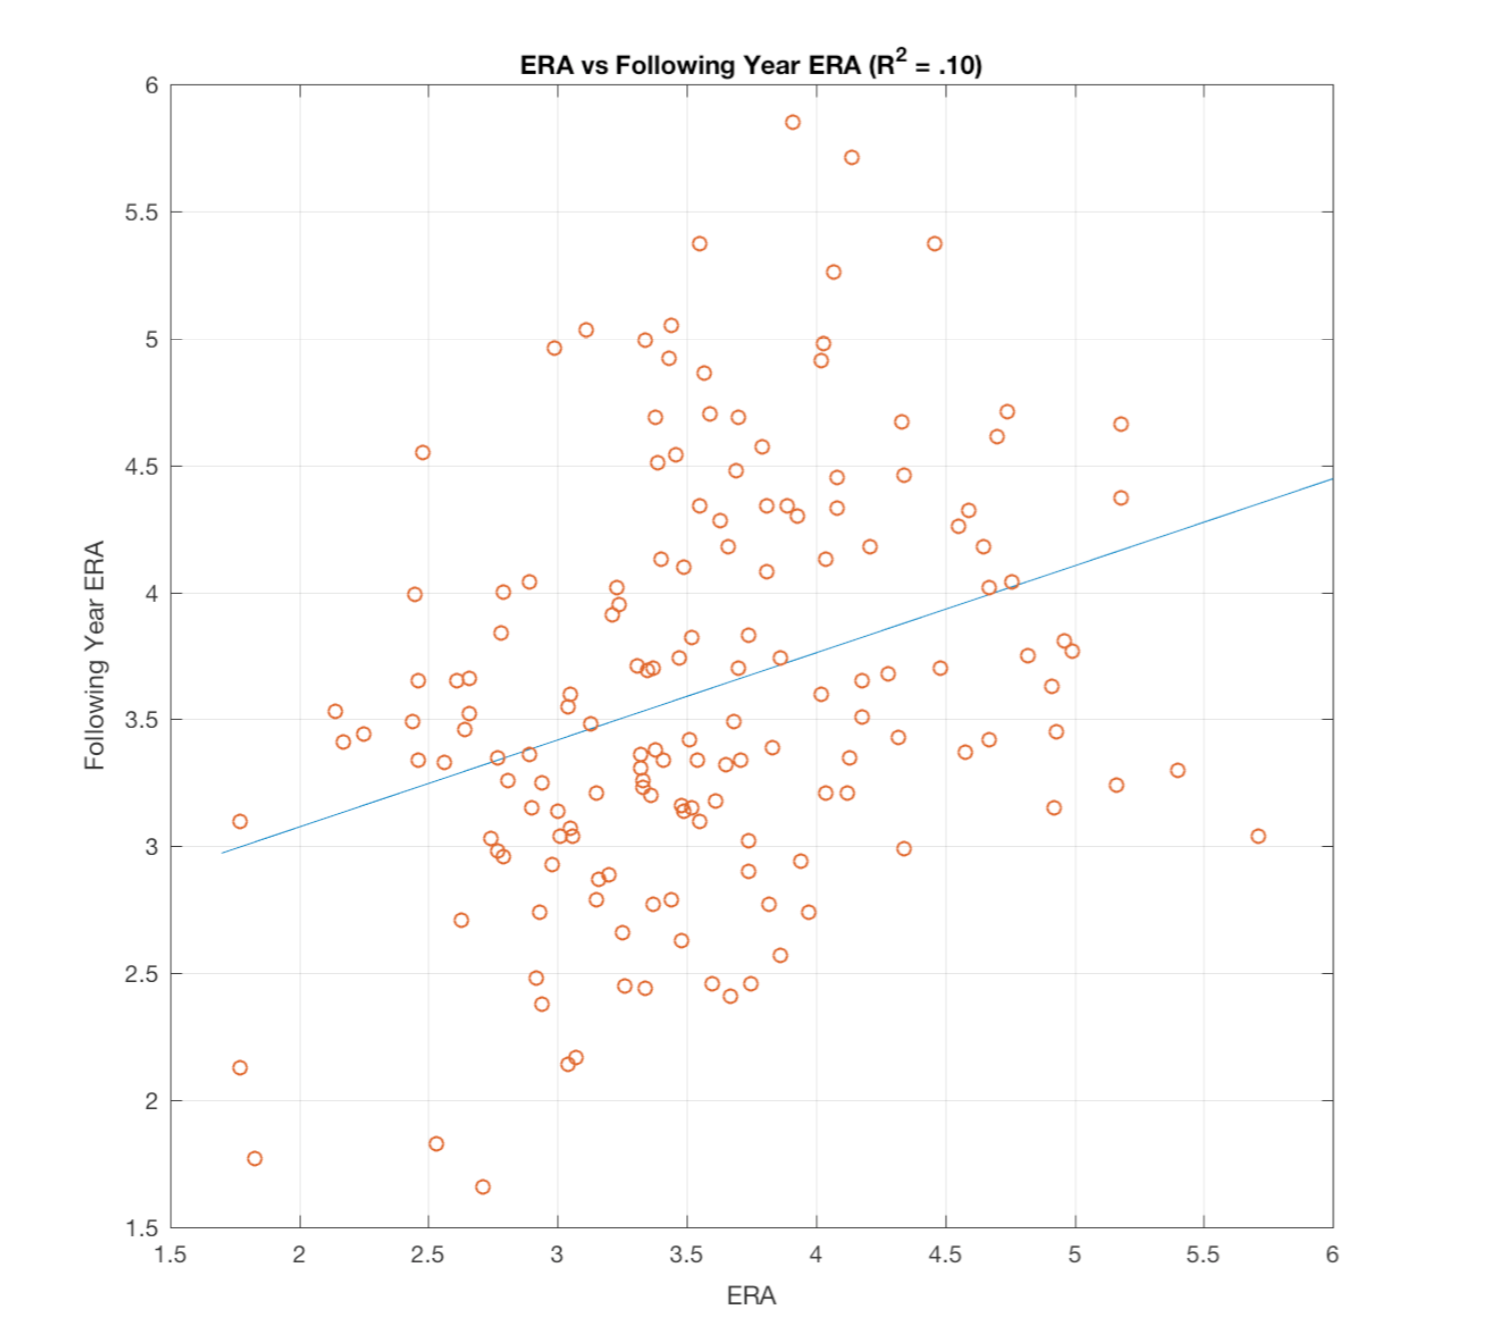
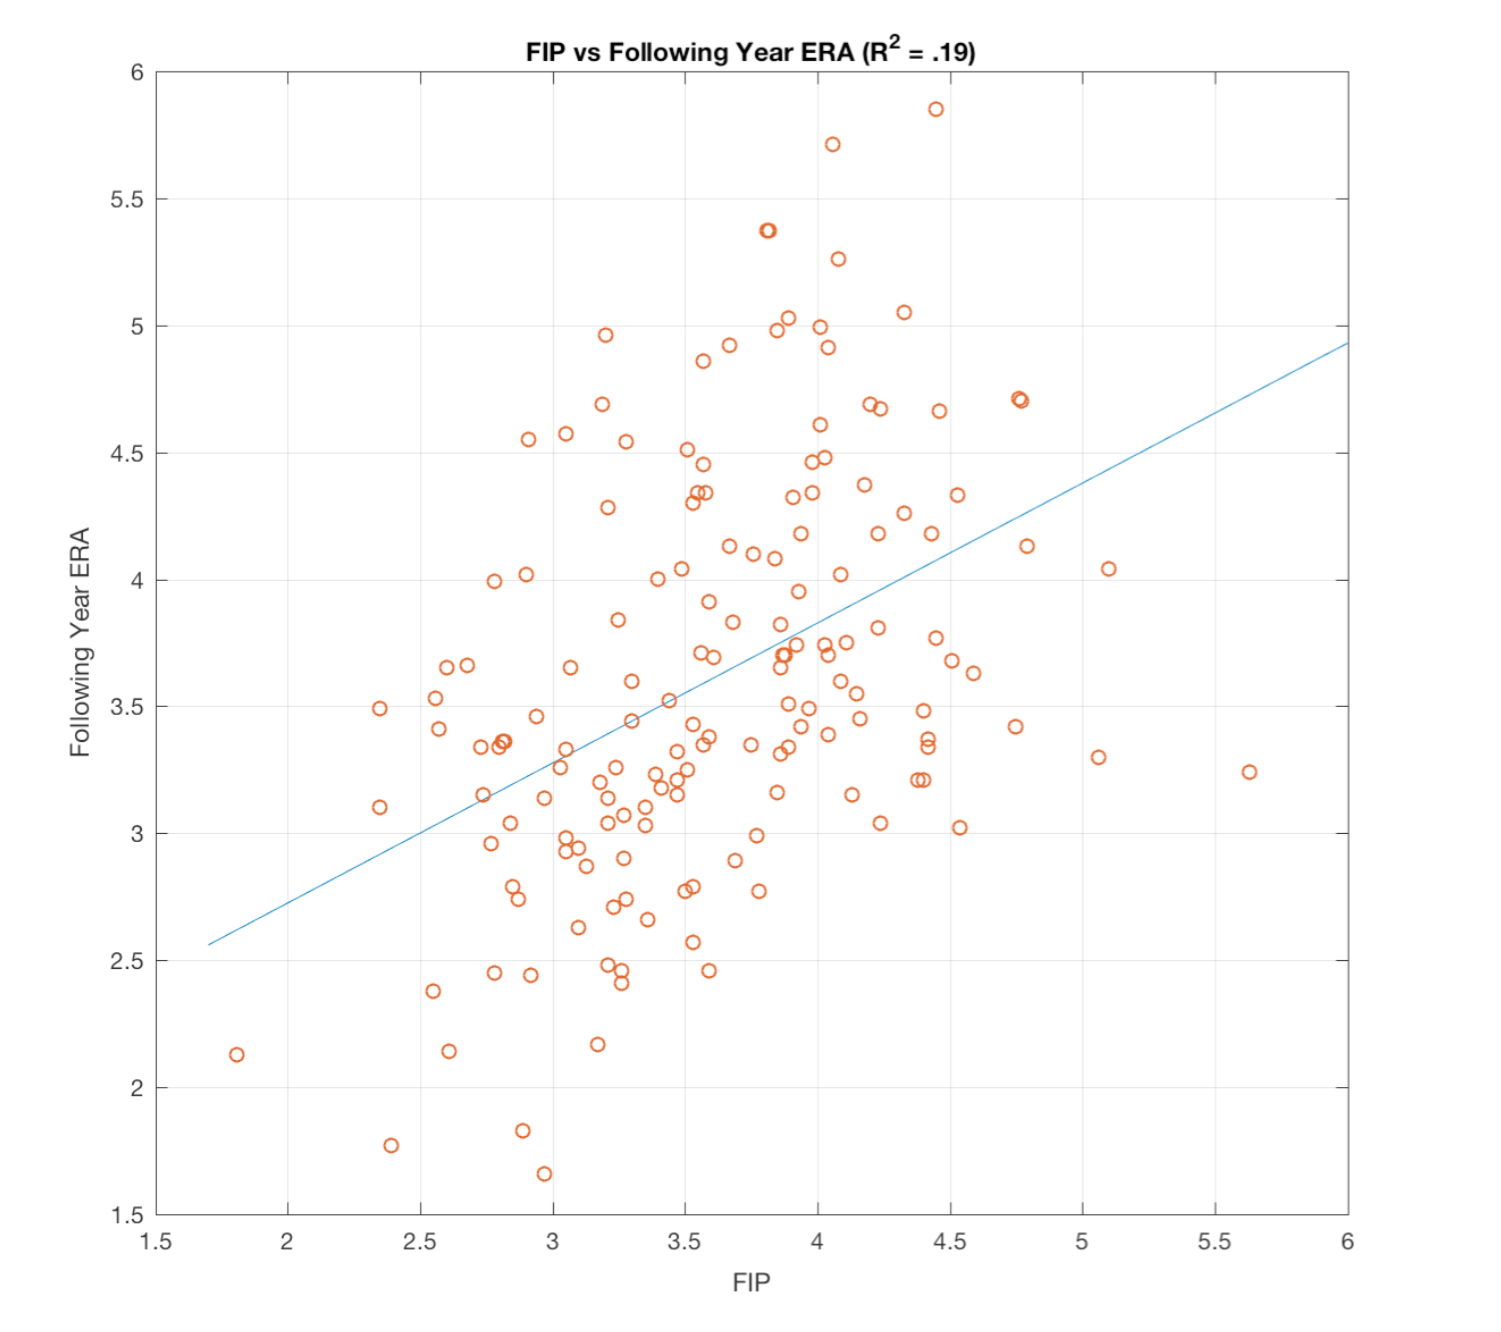
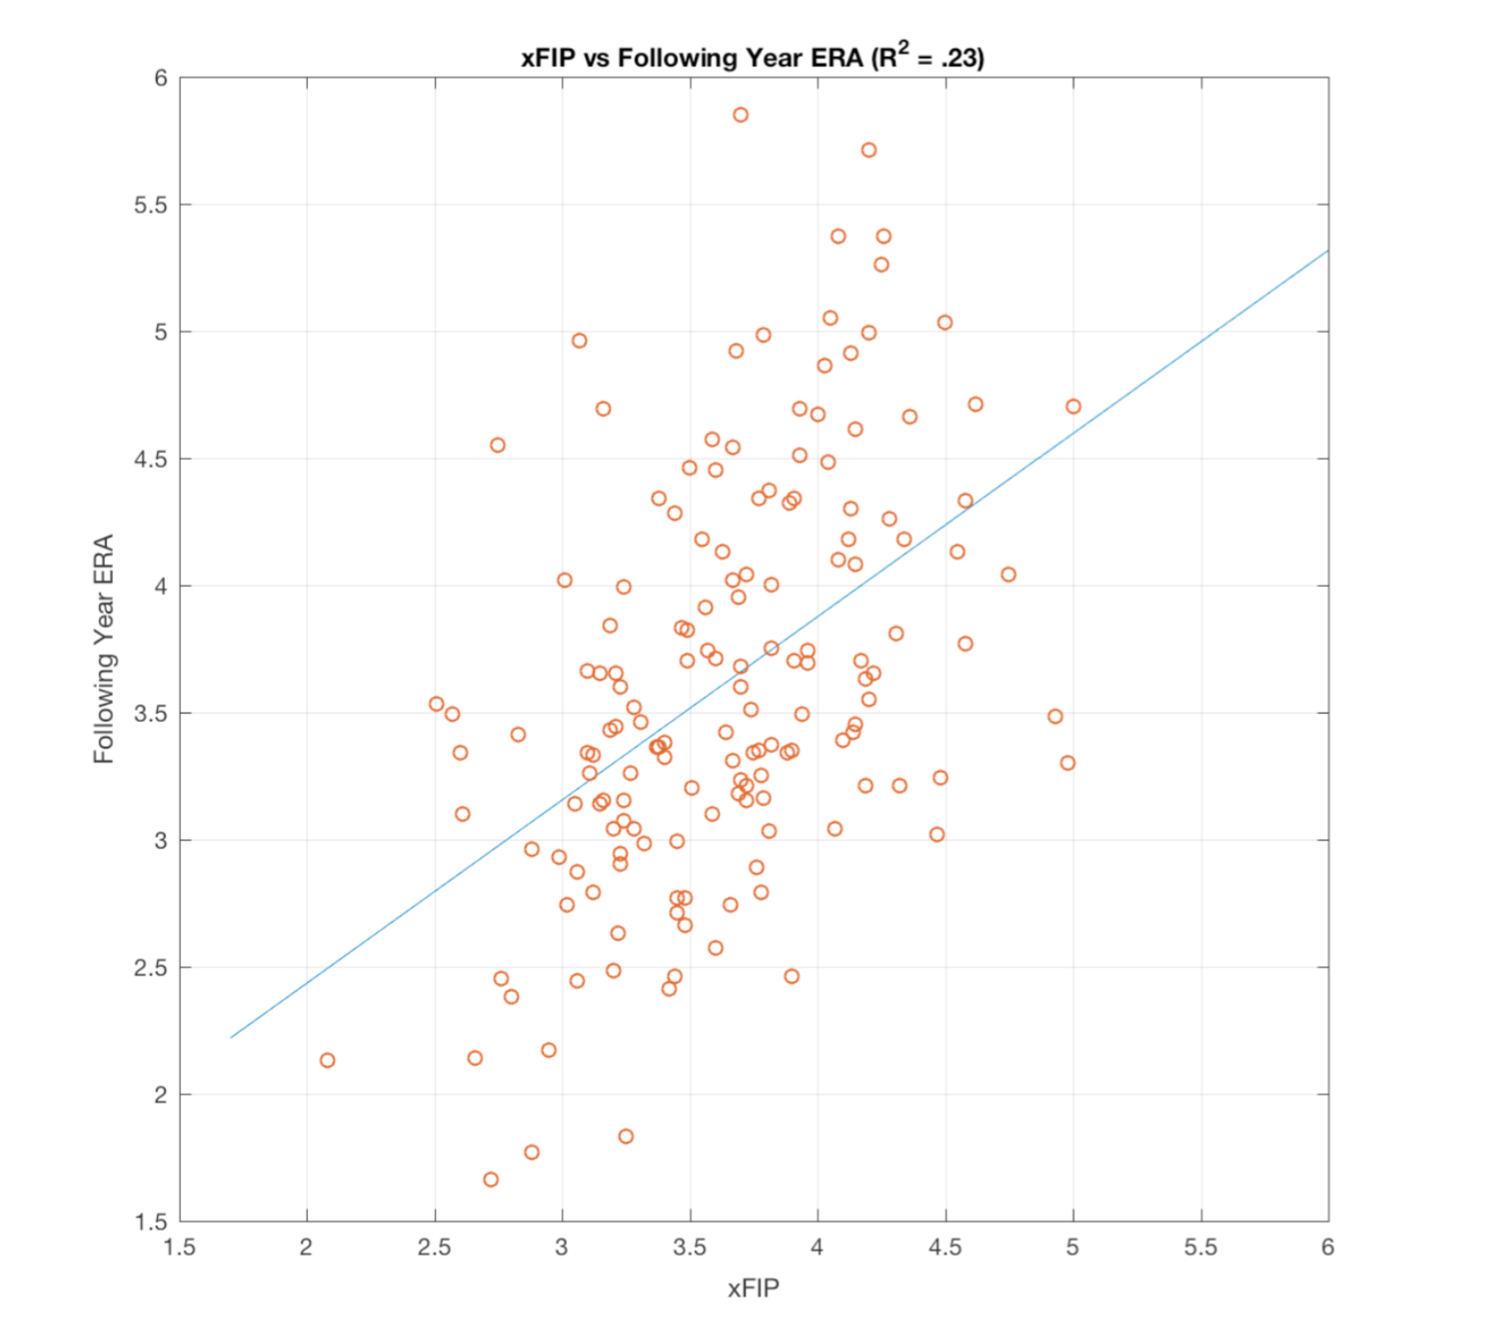
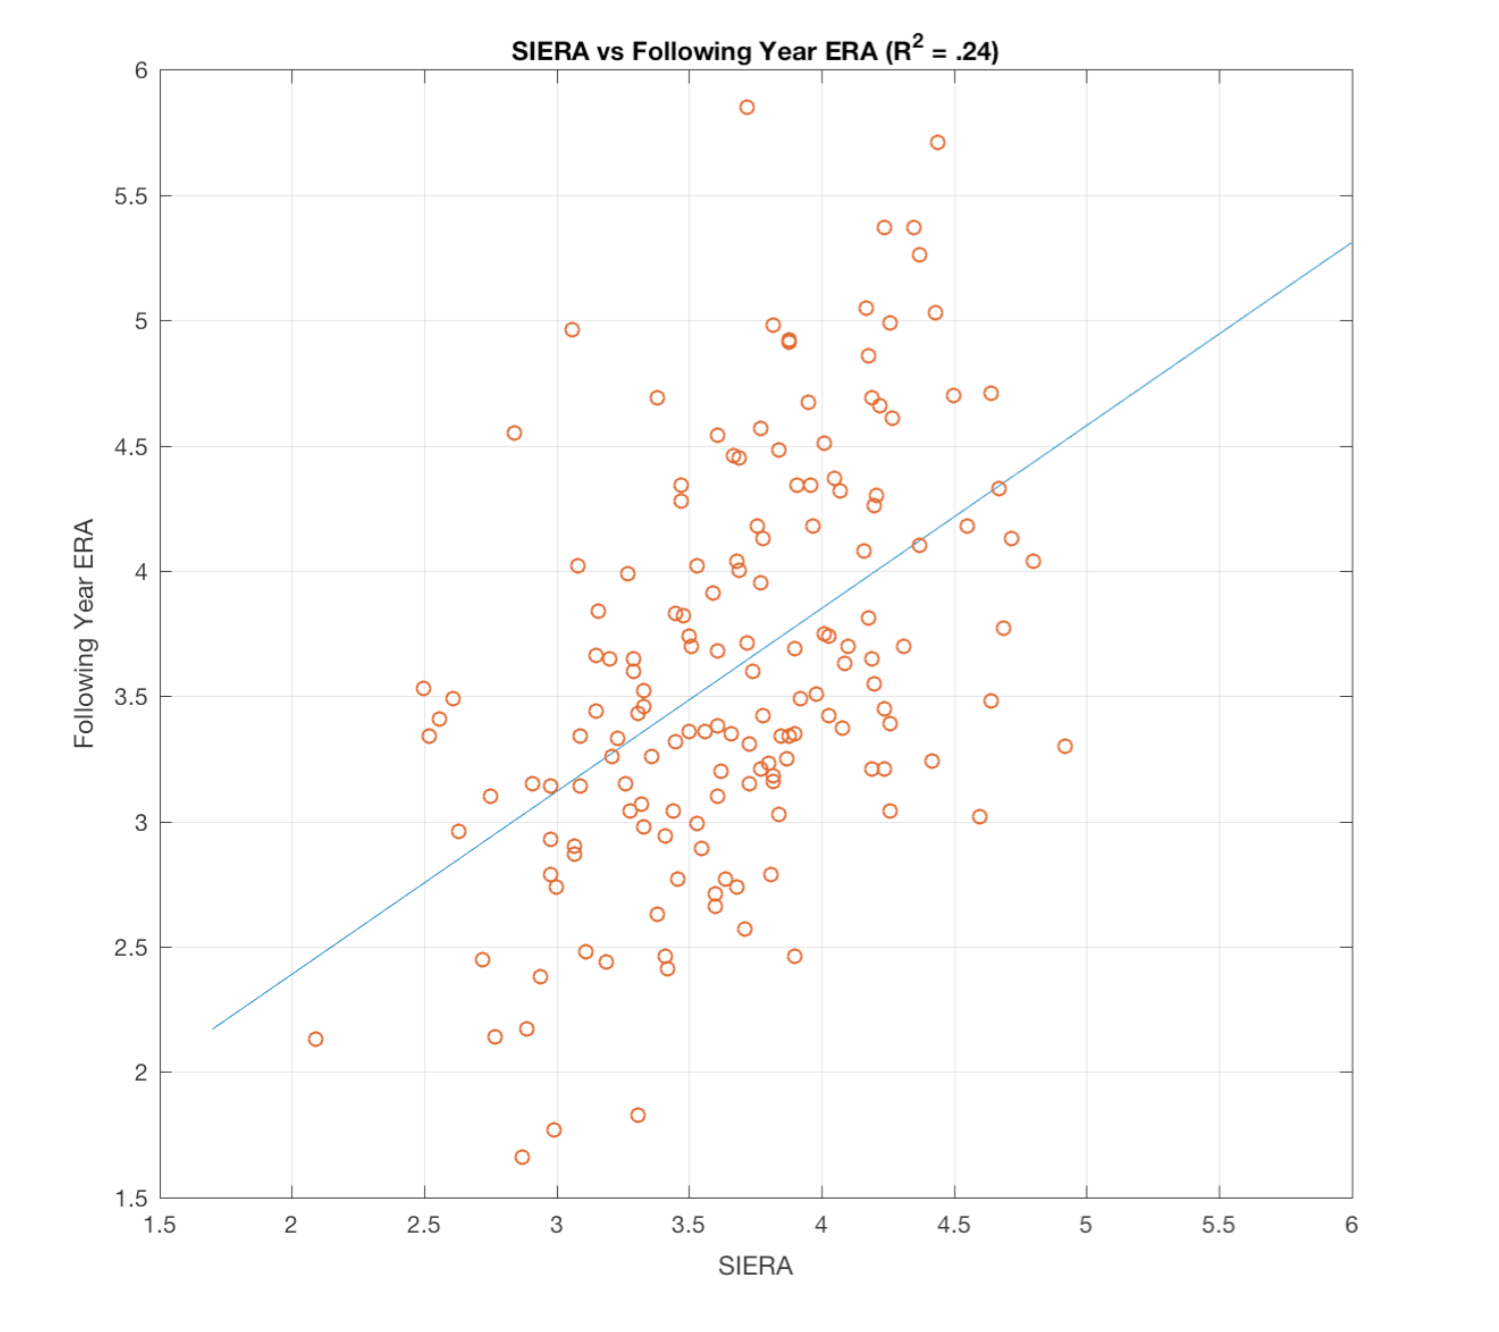
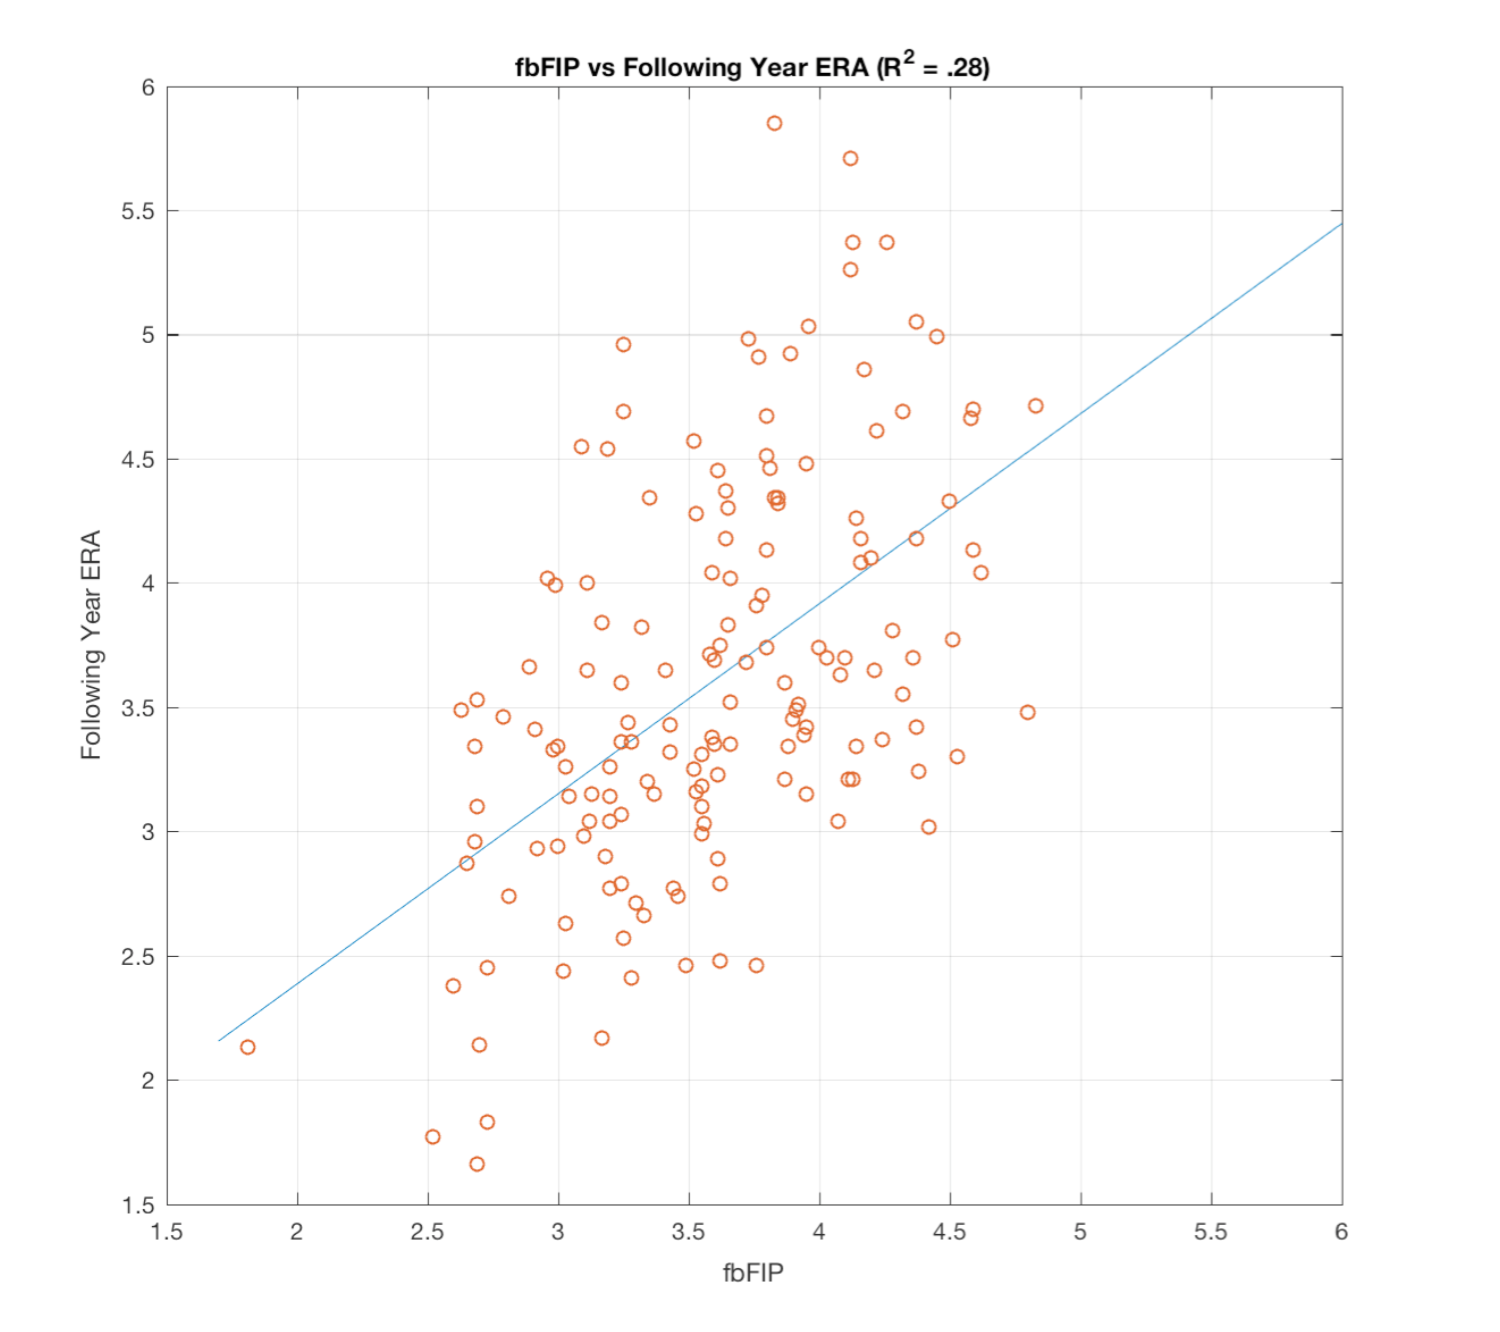
As you can see to the left, in this analysis (conducted on qualified pitcher seasons between 2012 and 2016), fbFIP was able to explain 28% of the variance in the following year’s ERA, even outperforming the sophisticated SIERA (“Skill Interactive Earned Run Average”) by 4%. I view this analysis as acceptably fair and rigorous, and as a result of it I am comfortable using fbFIP to project rest-of-season ERA in my Cy Young predictor. I think more than anything what this result drives home is just how untrustworthy ERA is, and why even those who are skeptical of taking contact quality completely out of the equation should not rely solely on that statistic as a reflection of a pitcher’s talent. ERA can be a fine first step to check in on how a pitcher’s year is going, but nothing that correlates so poorly year to year should be taken as seriously as is ERA currently.
Note: I have not yet figured out a way to keep a full leaderboard of fbFIP that does not involve large amounts of manual data entry, given that I need career HR/FB rates for every player. These are listed on Fangraphs on the player pages, but not on active season leaderboards, where the rest of the data needed for fbFIP comes from. If anyone knows a good way to query websites using Google Sheets or Numbers or Excel on Mac I’d appreciate any advice through the Contact page.