The tables above represent the current standing of my Cy Young Projector model, an ongoing project since about 2014. The key to this project, and what I find especially interesting about it, is that it does not directly measure which pitcher actually added the most value to his team, although that is the purported qualification for receiving the Cy Young award. There is ongoing and excellent research into this question, these days using information which costs a lot of money to access. Instead, my model is based on the past decisions of the voters.
Before each season begins, I go five years back in the award history, and in each year look at which major statistics the Cy Young winners of that season ranked highly in. If they came in first I assign that statistic a weight coefficient of 4. If they were in the top three I assign it a coefficient of 3. If they were top five, 2. If they were in the top ten, 1. The product of the number (between 0 and 2) of Cy Young winners who ranked in each statistic, and the coefficient of that statistic (itself determined by how highly the pitchers ranked in it), becomes its overall weight for the coming season. I perform this calculation for every year five years prior to the season I am attempting to predict, and sum all of these weights together for each statistic. I currently assign an arbitrary cutoff of 20, so that each statistic with a five-year cumulative weight above that number is factored into my model. In this way, I arrive at a rough quantification for which pitching statistics mattered the most to voters over the span of the past five years.
Running the model from this point is just a matter of tracking pitchers’ performances as a multiple of league average in each statistic that my vetting process has deemed important, and multiplying those numbers by the weight coefficients. Those products are summed, and then the whole thing is scaled so that a theoretical pitcher with perfectly league average numbers in every statistic in my model would have a score of 100. The name of the model, wCY+, is a play on the popular offensive statistic wRC+, which uses the same 100-as-league-average scale.
One detail to mention is that the statistic in the 8th column, fbFIP, is a statistic of my own creation, though only mine so far as I modified the long-useful statistic FIP. You can read more about this metric on its dedicated page here on this site, but the reason I include it is that I use it to project the end-of-season ERA for all the Cy Young candidates. Rather than simply use ERA in the model, I like to get a sense for what each pitcher’s ERA is going to be at the end of the season, when the final predictions are locked in. To do this, I simply take the pitcher’s remaining projected innings (found by extrapolating the pitcher’s current rate of innings per game over the rest of the games they are likely to pitch), applying the “earned runs” that fbFIP would give them for that time span, adding that to the earned runs they have already accrued, and then dividing that sum by nine and multiplying by total projected innings to find a projected ERA for the whole season that takes into account innings already pitched. Of course, by the time there are no more innings left to pitch, this metric will simply reflect a pitcher’s actual ERA, so this metric stands throughout the season as a permanent replacement for ERA.
Another small detail is that while the season is still in progress, I use fWAR, and then when the season is over I use Baseball Reference’s bWAR. The reason I use bWAR for the end of the season is that as far as I have observed it seems to be the favored WAR-type metric for mainstream 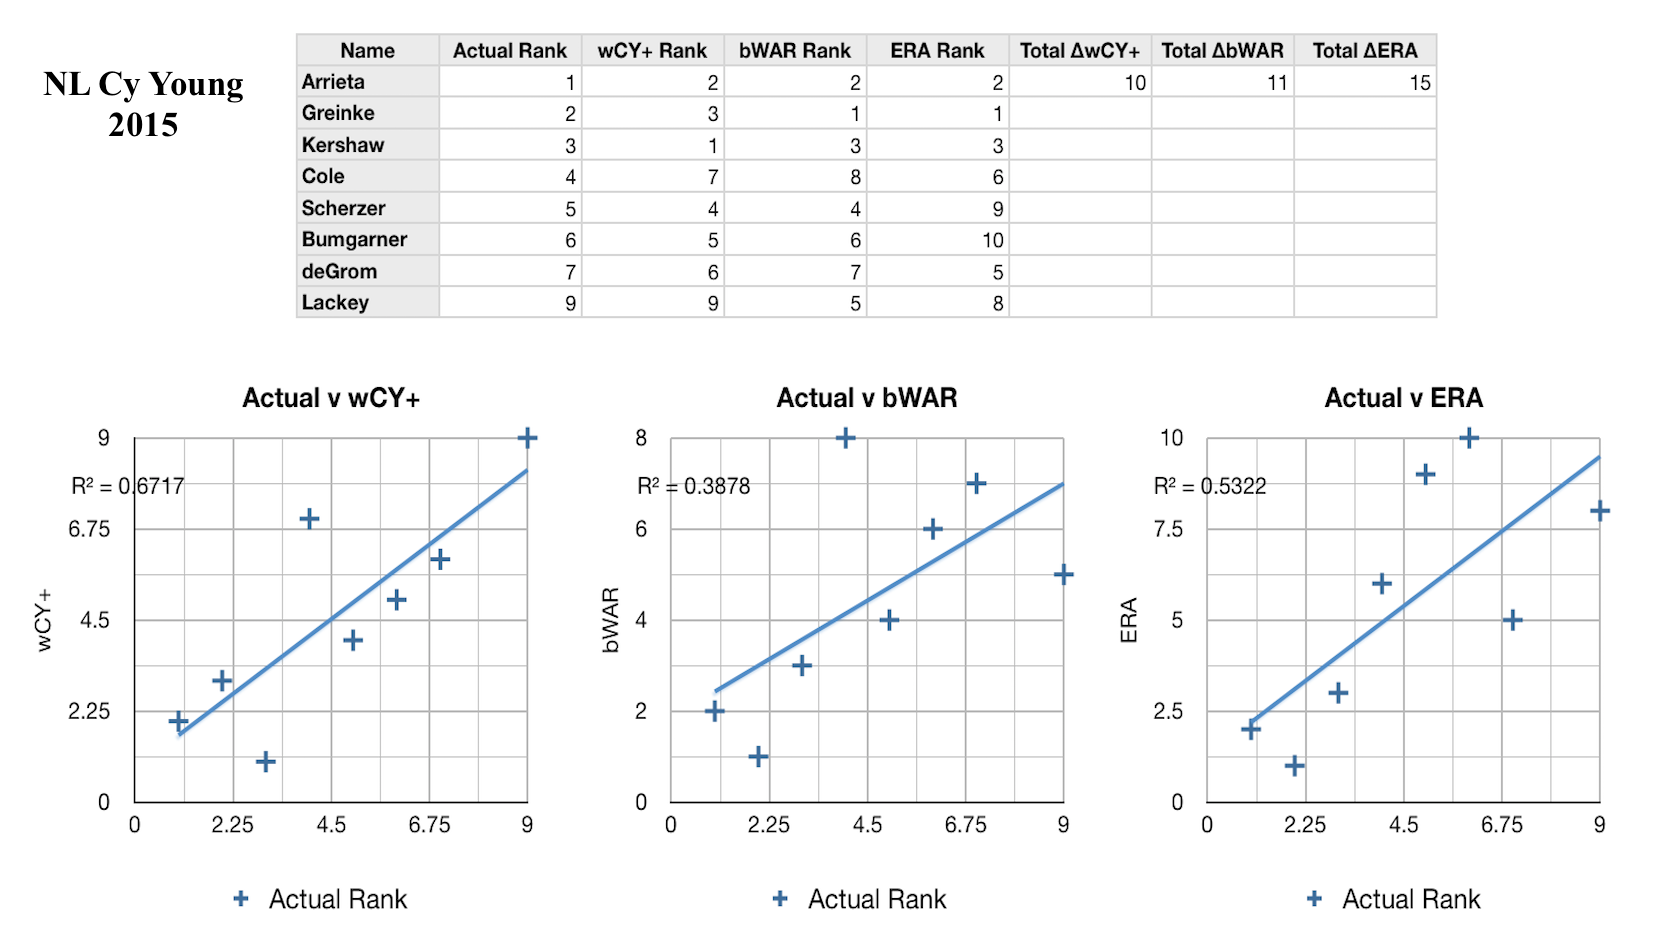
 sports journalists, and as the aim of this project is to model their thought process, it makes the most sense to use. The reason I use fWAR during the season is mainly one of convenience; I extract all of my data from Fangraphs, which is the home of fWAR. As an added bonus, however, it’s possible that the predictive power of FIP, which is used in fWAR instead of RA9, makes it more indicative of where that pitcher’s end-of-season bWAR will be than mid-season bWAR itself. Given the overall differences in calculation, I see this effect as pretty unlikely to be significant, but it can’t hurt I guess.
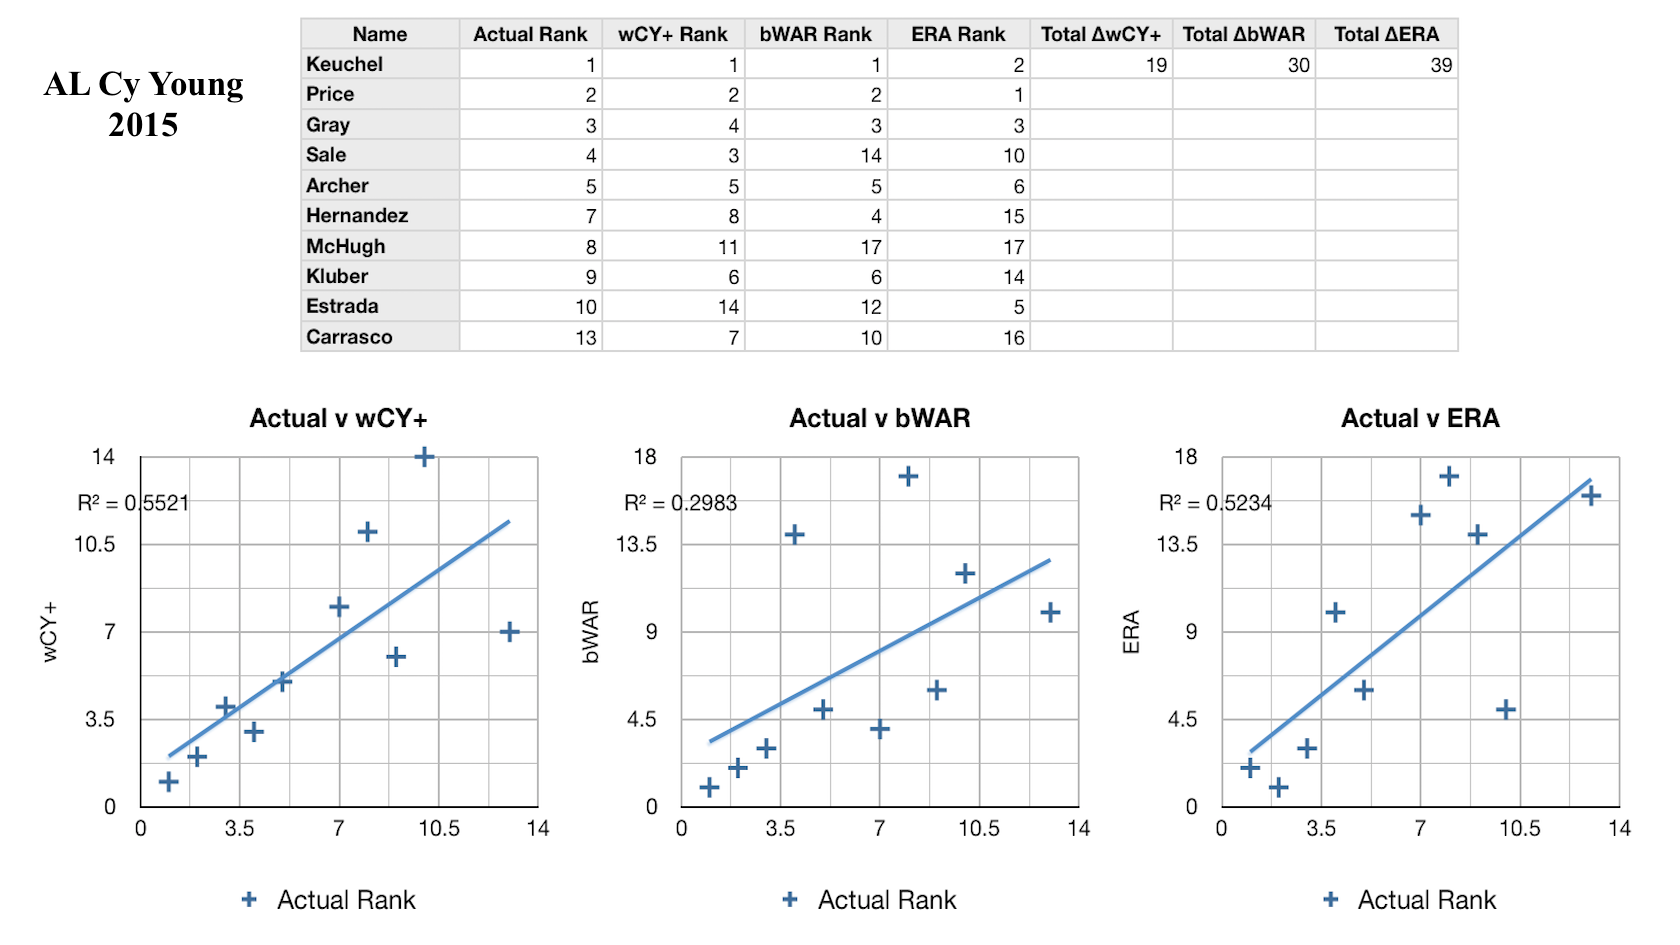
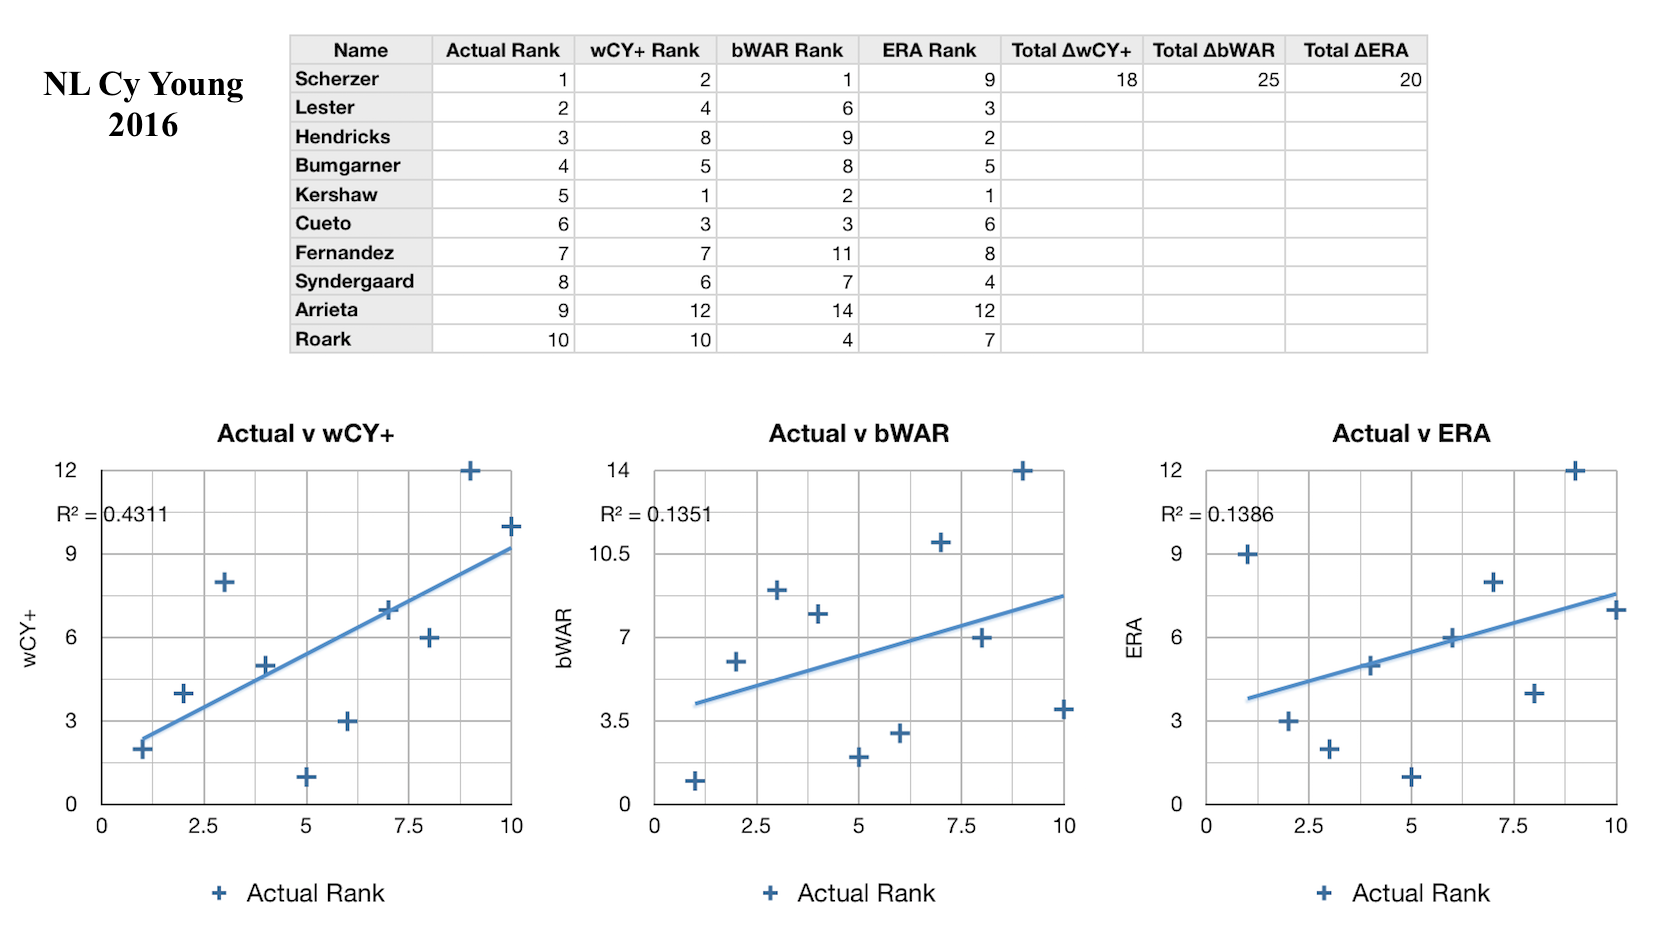
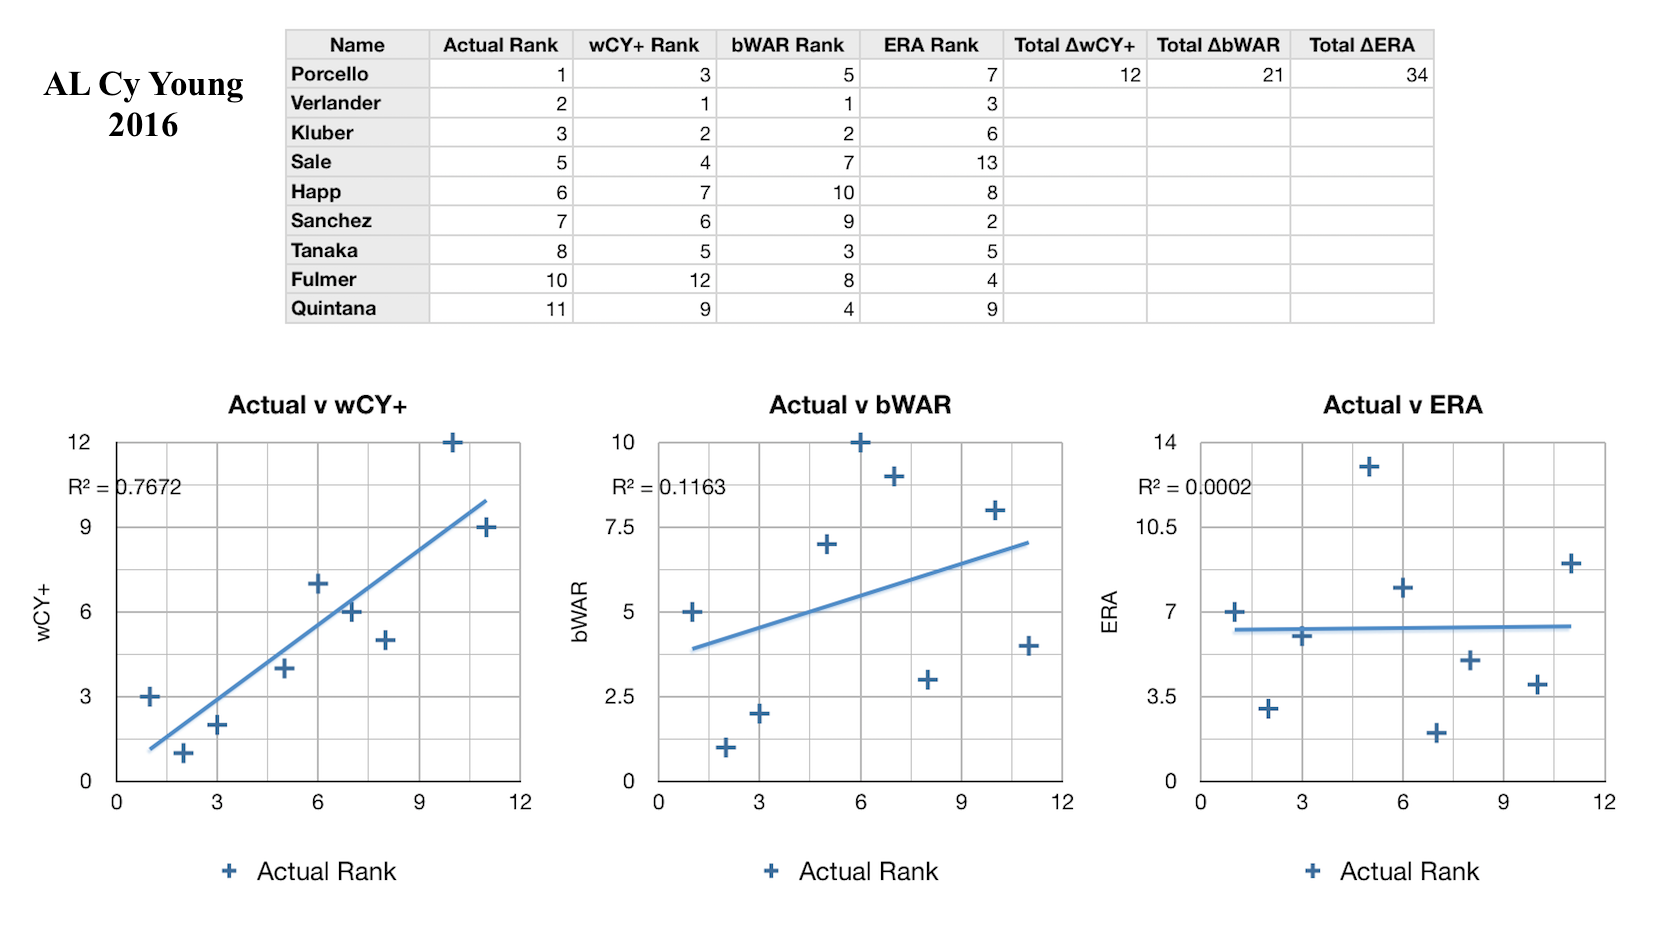
Every year I’ve calculated the new weights, always considering only the past five years, so that the formula is informed by what I hope is the most recent and accurate voting behavior. I would call it a modest success so far: the CY rankings as predicted by my formula have explained on average 62% of the variance in the actual CY rankings over the 6 years I’ve looked at, compared to 43% and 42% respectively for bWAR and ERA, which stand as two of the most widely-used pitcher talent evaluators. In the figures on the left you can see how the formula has performed against these baselines in some recent years. In each league and each year my formula has been more predictive than either bWAR or ERA. However, there are still a lot of improvements to be made. For one, this model only considers starting pitchers. This is obviously a major flaw, and one that I intend to fix, but in creating the formula I simply could not decide how to consistenly compare great starting pitcher seasons and great reliever seasons. Obviously relievers will have on average fewer innings pitched, fewer strikeouts, and fewer WAR, but also lower ERA and FIP, and some amount of saves, the reliever equivalent of wins (not that starters can’t get saves and relievers can’t get wins and losses, of course). This creates a fine framework for comparing relievers to other relievers, but comparing relievers to starters is much harder. It takes more than being among the best five or so relievers to get Cy Young votes; only one or two are nominated a year, if any at all. Clearly there is a way, if this process as a whole is to be believed in, but it will take more research. I would also love it if so many of the elements weren’t so arbitrarily determined. My method paints a crude picture of which statistics matter most to voters, but an analysis incorporating how they ranked the pitchers who came in second place for the award, or third place, would be even more insightful. In addition, it’s possible to see the total breakdown of the votes in each year, which could be a source for even more useful information. For example, if a certain pitcher placed fifth in the voting overall, but had more first-place votes than the second-place pitcher, that may tell a story about the traits of these two pitchers not captured by the simple ranks. All of this will lead to more complex models. Ultimately, I think it will even be possible to apply machine learning to this, and train it to learn from each year’s voting result on its own.